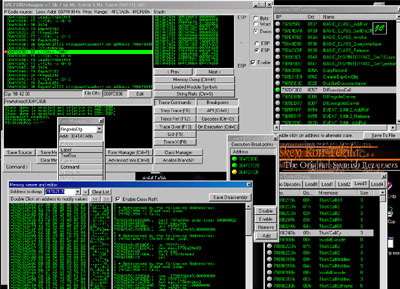
WKTVBDebugger

a Debugger for Visual Basic P-Code Compiled Apps

by MrSilver & MrSnow [WKT!] 2001


Click to enlarge screen shot

!Download New v1.4!

This new versions can debug files manipulated by vbshrink, also and opcode bug was fixed.

Please read the mini-FAQ if you're in trouble

If you wanna add this site to your links please use any of the following URL:

http://vbdebug.whiskeykontekila.org http://wktvbde.cjb.net http://vbdebug.cjb.net

Wanna write a tutorial about using WKTVBDebugger?
Cool!!, if you do please send it to us, we will open a new section very soon, containig tutorials about the debugger.
Also for generic questions about the program, bug reports etc. contact us at:

[email protected]

V1.4 Features:

- Anti-vbshrink code added, now the loader can complete erased info needed to debug the file.
- Various opcodes bug fixes (Lead3/3eh).

V1.3 Features:

- Loader import DLL bug fixed, now it searchs all the import table for the VM dll.
- Various opcodes bug fixes.
- The x86 disassembler is improved and corrected.
- Fixed a minor bug inside the dumping utility, the dumper didn't displayed some special chars.
- Some memory leaks fixed. Yeah, don't ask me why :)

V1.2 Features:

- Improved disassembly, now you have events, propierties and methods recognition.
- Trace X command (traces X lines of code).
- New installer, no more dll errors, easy to install.

V1.1 Features:

- Run-time live debugging.
- Supports VB5 and VB6 P-Code compiled applications.
- Displays a complete list of opcodes and VM API functions, can save the list to a file.
- Breakpoints on any p-code instructions.
- Breakpoints on any code address (unlimited).
- Can put breakpoints on any Virtual Machine API call.
- Stack viewer, dumps the stack in two different modes: from EBP to ESP or from ESP to EBP.
- Three different modes for stack viewing , Byte, Word and Dword.
- Memory dumper and editor with support for file dumping with three different file formats, RAW HEX or C array.
- Displays memory as ASM code, you can disassemble any module loaded by the process, shows jump refrences.
- Memory search functions, can search ASCII, WIDE char strings and HEX digits.
- Complete display of current opcode bytes.
- Can log debugger messages and p-code to a text file.
- Can modify opcodes at run-time using the memory editor (changes does not affect the file only the memory is changed).
- String references support, you can view/edit any string used by the current routine or function.
- Shows current routine starts address and end address.
- Advanced EXE Info, shows extended info about the P-code file (Modules, Clases, Forms) can log everything to disk.
- Show file offset of any instruction from its RVA, especially designed for those of you that like file patching ;)
- Support for Debug Symbol files (DBG) loads any DBG file automatically, can log symbols to disk, if no DBG is found shows the export info only.
- Easy integrated manager for Forms and Classes, shows common VB controls unknow controls and user controls.

- BranchX Analizer, builds a list of all the bifurcation opcodes and allows you to directly breakpoint on them.

Greetings to the following people:

Duffie (you're the best, I don't care if you don't know how to crack), NeSTe (when are you going to start learning VB? ;-> ), JosephCo (Hi! guy thx for your advices and info, at last we did it!), Skuater (this won't be the last time we work together), Gadix (Hi! stop fucking cd-protections and do some keygens xDD ), Izcelion (thanx for you help ;), Blaz (wanna see you soon among us), all the WKT! members and all the fellows at #crackers at Irc-Hispano.


topica
 Join the WKT! VBDebugger! MAILING LIST 
 Apuntate a la lista de correo de WKT! VBDebugger! 


Powered by counter.bloke.com